The pulse of your
contact centre.
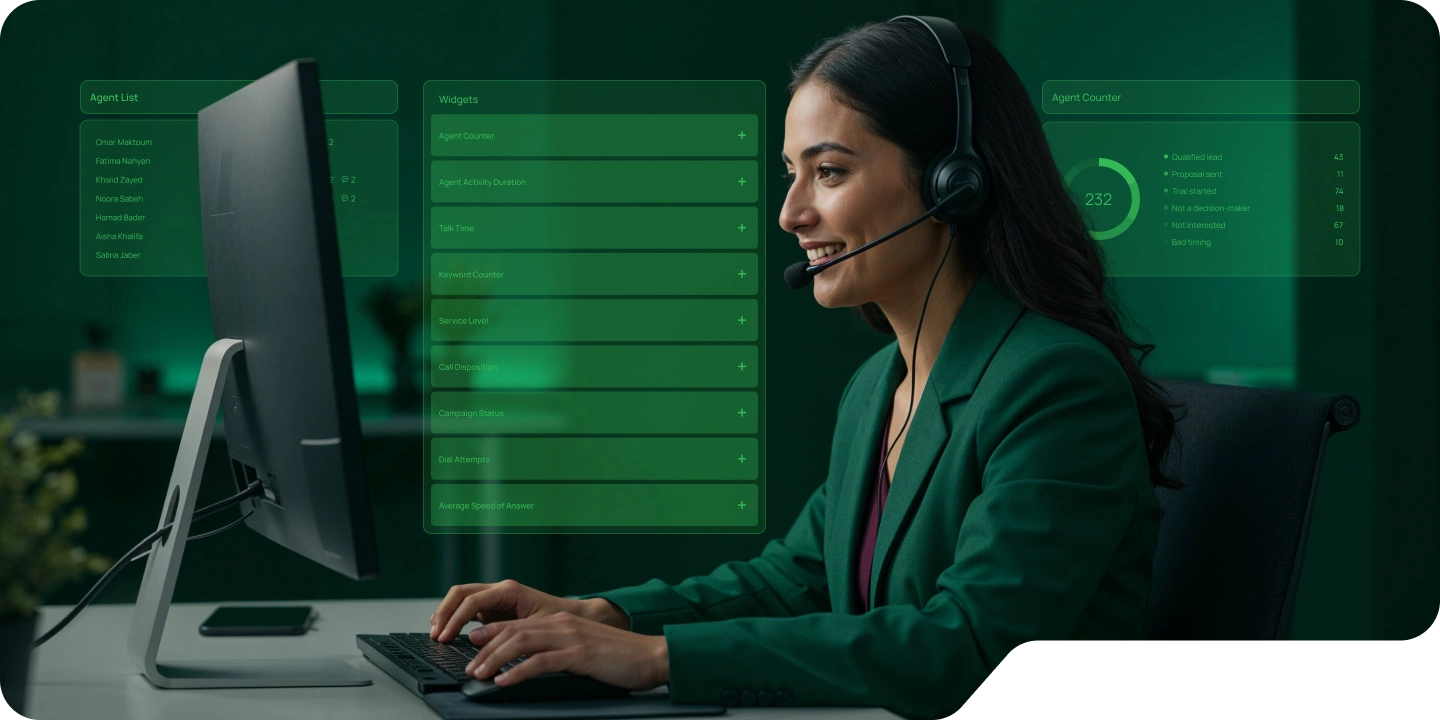
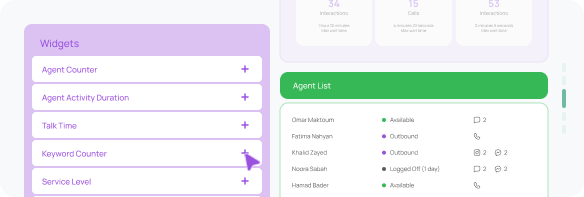
TabaTalk dashboards show you what’s happening, as it happens, so you can support your team, fix issues fast, and keep every conversation on track.


at a glance.
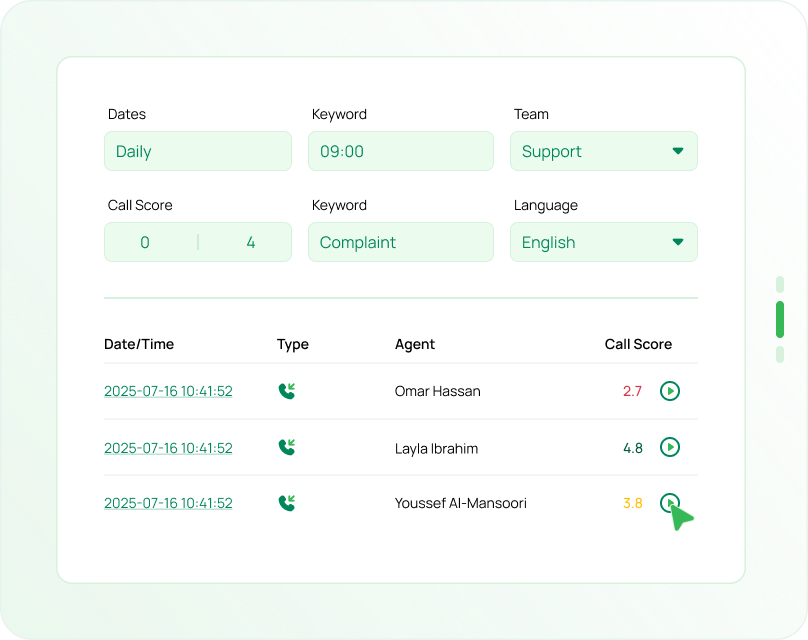
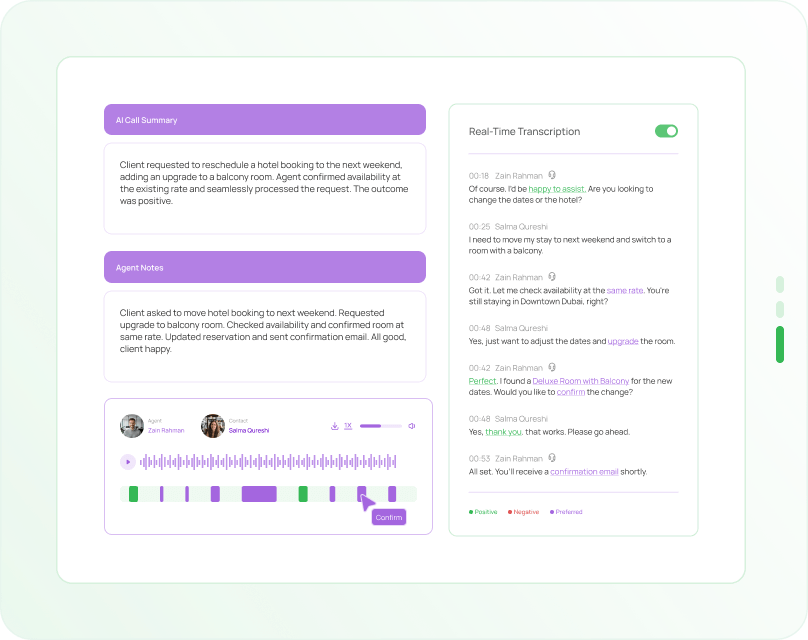
to understand the call.
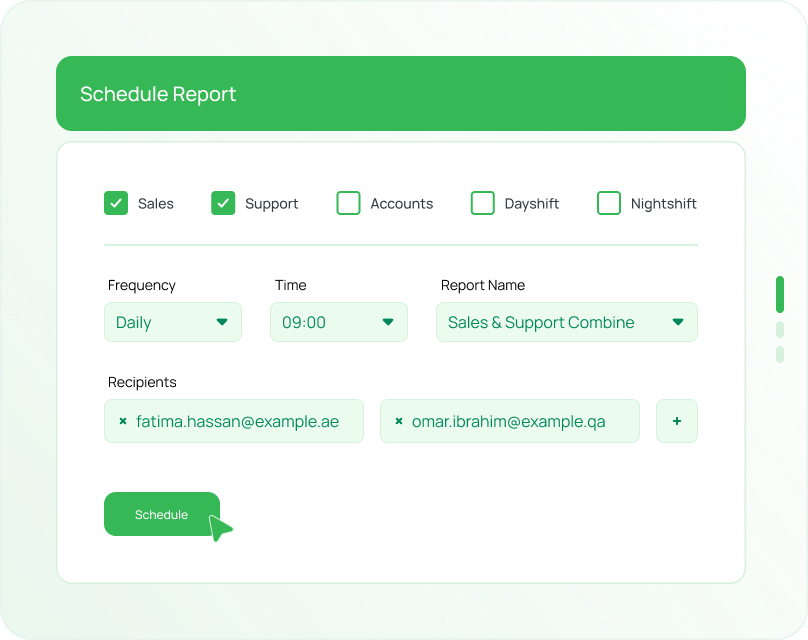
Stay in sync,
without the stress
More ways TabaTalk
helps you deliver.
Every channnel,
one workspace.
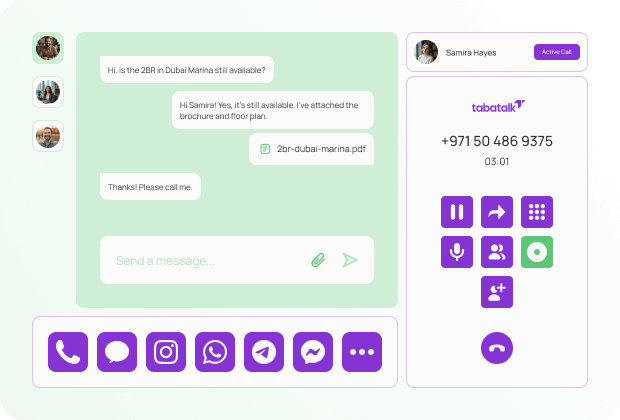
Connect faster. Stay focused.
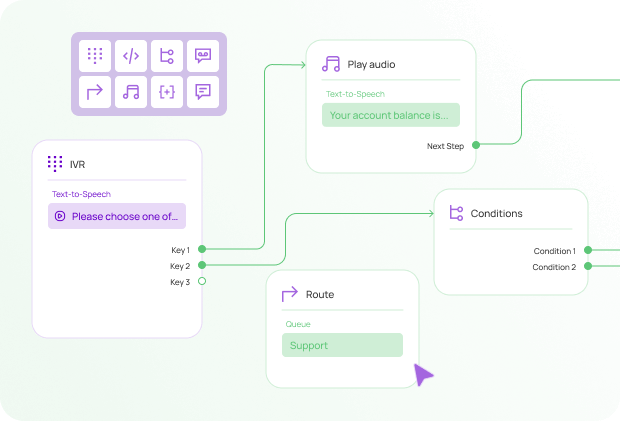
Build journeys
that work.
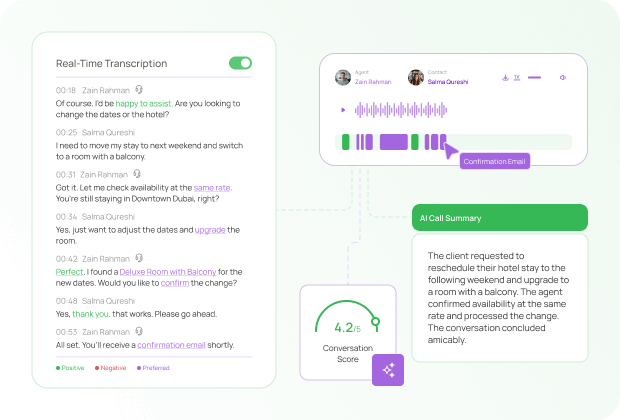
Understand what’s really said.
Ready
when you are.
wondering
Can I customise the dashboards for different teams?
TabaTalk enables unlimited dashboard creation tailored to specific departments, roles, or performance objectives. Sales managers might track conversion rates and outbound campaign metrics, while customer service leaders monitor queue wait times and resolution statistics. Each team accesses only the data relevant to their responsibilities, eliminating information overload from irrelevant metrics. The platform provides drag-and-drop customization allowing users to select widgets displaying key performance indicators, apply filters narrowing focus to particular agents or time periods, and arrange layouts for optimal visual clarity. Marketing teams can build dashboards tracking lead source effectiveness; operations directors might emphasize call volume trends and staffing efficiency. This flexibility ensures every stakeholder sees actionable insights without technical assistance, transforming raw contact center data into role-specific intelligence that drives targeted improvements.
Which metrics can I track in real time?
Contact center dashboard software displays live performance indicators including current call volumes, active agent counts, average wait times, queue depths across departments, and service level adherence percentages. Managers monitor individual agent status, available, on calls, in after-call work, or offline, enabling dynamic workload balancing. Real-time analytics reveal answer rates, abandonment statistics, first-call resolution percentages, and average handling durations as conversations occur. Outbound campaign dashboards track connect rates, successful conversions, and dialing efficiency metrics throughout active calling sessions. The system updates visualizations continuously, typically refreshing every few seconds, ensuring leadership always bases decisions on current conditions rather than outdated snapshots. Alerts trigger automatically when metrics breach predefined thresholds, drawing attention to emerging issues requiring immediate intervention before they significantly impact customer service quality or operational targets.
How do I know when something needs attention?
Intelligent alerting systems built into contact center management platforms notify supervisors immediately when performance dashboards detect threshold violations or unusual patterns. Configurable rules trigger notifications when queue wait times exceed acceptable limits, abandonment rates spike above normal ranges, or service levels drop below contractual commitments. The dashboard software highlights problematic metrics using color coding, red indicators for urgent issues, yellow warnings for developing concerns, enabling quick visual assessment of overall operations health. Email, SMS, or in-platform alerts reach managers wherever they're working, supporting both office-based and remote supervision. Historical trending helps distinguish temporary fluctuations from sustained problems requiring strategic intervention. Supervisors customize sensitivity settings, balancing responsiveness against alert fatigue from minor variations. This proactive monitoring transforms reactive management into predictive operations where problems get addressed before customers experience negative impacts.
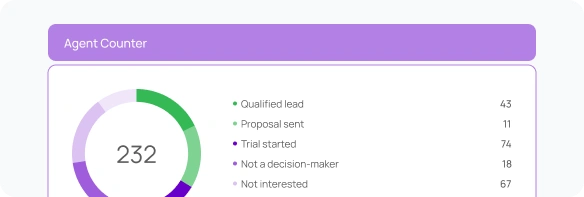
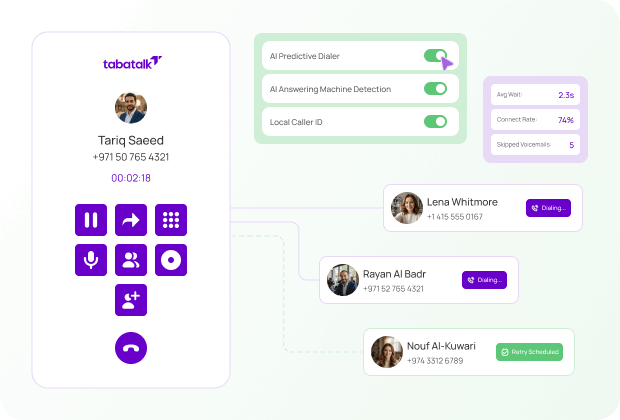
Can I track outbound campaign performance?
Dedicated widgets within TabaTalk's performance dashboards provide comprehensive visibility into outbound calling initiatives, displaying connect rates, conversation durations, conversion percentages, and dialing efficiency metrics. Managers monitor how many contacts each campaign reaches hourly, which scripts or offers generate strongest responses, and whether teams maintain acceptable abandonment rates within regulatory compliance boundaries. Real-time dashboards show individual agent productivity, calls completed, successful outcomes achieved, and average handling times, enabling immediate coaching when representatives struggle or recognition when they excel. Campaign comparison views reveal which list segments yield superior results, informing strategic resource allocation decisions. The analytics track answer rates across different calling hours, helping optimize scheduling for maximum contact likelihood. Integration with CRM systems connects dashboard data to pipeline value, demonstrating revenue impact from outbound efforts and justifying continued investment in proactive customer engagement strategies.
Do I need technical skills to build a dashboard?
Building functional dashboards requires zero coding knowledge or IT expertise. TabaTalk's intuitive interface operates through drag-and-drop interactions where users select desired widgets from visual libraries and position them within customizable layouts. Configuration happens through simple forms and dropdown menus rather than complex scripting or formula writing. The platform offers pre-built templates covering common use cases, sales performance tracking, customer service monitoring, quality management, accelerating initial setup while allowing subsequent customization matching specific organizational needs. Most users create their first meaningful dashboard within minutes of platform access. Contextual help explains what each metric measures and which visualization type best represents different data types. This accessibility democratizes analytics, empowering frontline supervisors, team leads, and department managers to build personalized views independently rather than submitting requests to overburdened technical teams and waiting days for development cycles.
How do dashboards improve contact centre performance visibility?
Real-time dashboards consolidate dispersed operational metrics into unified views accessible to managers, supervisors, and frontline staff simultaneously. Instead of manually gathering data from multiple systems, leadership sees comprehensive performance snapshots instantly, identifying trends requiring attention before they escalate into serious problems. The visual presentation, charts, gauges, and trend lines, communicates complex analytics more effectively than spreadsheet rows, enabling faster comprehension and decision-making. Historical comparison features reveal whether current performance represents improvements or deterioration relative to previous periods, providing essential context for interpretation. Customizable widgets highlight the specific key performance indicators each role needs most, eliminating distractions from irrelevant information. Teams gain transparency into how individual contributions affect overall objectives, fostering accountability and motivation. This comprehensive visibility transforms management from reactive problem-solving into proactive optimization guided by continuous data streams.
Why do businesses need real-time operational dashboards?
Contact center environments change rapidly, call volumes spike unexpectedly, agents become unavailable suddenly, or system issues emerge without warning. Real time monitoring enables immediate responses that minimize customer impact from these dynamic situations. Supervisors reallocate staff between queues instantly when dashboards reveal imbalanced workloads, preventing some customers from waiting excessively while other agents sit idle. Early problem detection through live metrics allows corrective action before service levels breach contractual commitments or regulatory compliance thresholds. The analytics support data-driven scheduling decisions, revealing precise staffing requirements for different times and days based on actual demand patterns rather than assumptions. Performance dashboards provide objective feedback to agents and teams continuously, reinforcing positive behaviors and identifying coaching opportunities while interactions remain fresh in participants' memories. Delayed reporting diminishes actionable value; immediate visibility drives superior outcomes.
What features should contact centre dashboard platforms include?
Essential capabilities encompass customizable widgets displaying key metrics like call volumes, wait times, agent availability, abandonment rates, and first-call resolution percentages. Real-time analytics must refresh continuously, ideally updating every few seconds to support dynamic decision-making. Multi-level access controls ensure agents see appropriate personal metrics while supervisors view team statistics and executives access enterprise-wide performance summaries. Historical trending tools should enable period-over-period comparisons, revealing whether current results represent improvements or require intervention. Alert configuration allows managers to define threshold triggers for automatic notifications when problems emerge. Integration with existing call center software, workforce management platforms, and CRM systems ensures comprehensive data aggregation without manual entry. Mobile accessibility supports remote supervision through smartphone or tablet interfaces. Exportable reports facilitate sharing insights with stakeholders lacking direct platform access. Drill-down functionality lets users investigate summary statistics by exploring underlying detailed records.
Does dashboard software integrate with CRM systems?
Modern contact center dashboard software connects seamlessly with popular CRM platforms including Salesforce, HubSpot, Zoho, and Microsoft Dynamics through pre-built integration connectors. This connectivity enables performance metrics to incorporate customer satisfaction scores, sales pipeline values, support ticket resolution rates, and other business outcomes tracked within relationship management systems. Unified views combine operational efficiency indicators, like average handling time, with customer experience measurements and revenue impact data, providing holistic assessments of contact center effectiveness. The bidirectional data flow enriches both platforms: dashboards display CRM-sourced customer context while relationship management tools receive call activity updates automatically. Managers generate comprehensive reports correlating agent performance with pipeline conversion rates or customer lifetime value trends. API connectivity supports custom integrations with proprietary business systems, ensuring analytics incorporate whatever data sources matter most to organizational success. This integration eliminates siloed reporting that obscures connections between different operational dimensions.
Can dashboards benefit both small teams and enterprise contact centres?
Cloud-based dashboard platforms scale appropriately for organizations ranging from small businesses with handful of agents to multinational enterprises managing thousands of representatives across multiple regions. Small teams gain professional-grade analytics previously accessible only to large corporations with substantial technology budgets. The subscription pricing model makes advanced visualization capabilities affordable regardless of company size. Growing organizations expand usage seamlessly as operations mature, adding users, metrics, or customization sophistication without platform migrations. Enterprises appreciate multi-tenant architecture supporting separate divisional views, granular role-based access controls, and consolidated executive reporting across geographies. Deployment speed benefits all sizes equally, most platforms activate within hours rather than weeks. Smaller operations identify improvement opportunities quickly through focused metric tracking; larger enterprises uncover systemic trends across diverse teams. The technology delivers proportional value scaled to operational complexity and strategic requirements.
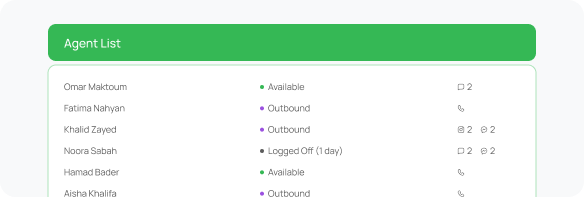
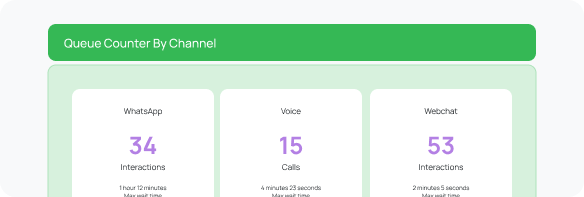
Can real-time dashboards track agent activity and queue performance?
Comprehensive agent dashboards display individual status (available, busy, after-call work, break), current call duration, total calls handled today, average handling time, and adherence to scheduled shifts. Supervisors monitor entire team rosters simultaneously, identifying who needs assistance with difficult calls or recognition for exceptional productivity. Queue performance widgets show calls waiting, longest wait duration, average queue time, service level achievement percentages, and abandonment rates across different contact center departments or skill groups. The analytics reveal which queues experience bottlenecks requiring immediate staff reallocation from underutilized areas. Historical trending compares current queue depths against typical patterns for specific times and days, distinguishing normal fluctuations from anomalous situations requiring escalation. Color-coded visual indicators, green, yellow, red, enable quick health assessments without detailed examination. This granular visibility supports both tactical interventions addressing immediate problems and strategic optimizations improving sustained operational efficiency.